BreatheEasy — AQI Intelligence System
A real-time AQI analysis and forecasting system that turns complex air quality data into clear, usable insights.
What if the air you breathe could speak? Most of us see AQI as just a number, without really understanding what it means for our health or daily life.
The Problem
Air quality data is widely available, but it is not easily understandable in terms of real-world impact. Raw AQI values, pollutant codes, and scattered datasets make it difficult for people to interpret what the air actually means for them.
- —Raw AQI numbers without context
- —Confusing pollutant breakdowns
- —No clear health interpretation
- —No short-term predictive insight
What We Built
BreatheEasy is a system designed to bridge that gap — combining real-time data, historical trends, and machine learning to make air quality understandable and actionable.
System Overview
The system integrates live AQI data, weather forecasts, and historical datasets into a unified pipeline. A trained LightGBM model generates predictions, which are then calibrated against live data to improve accuracy.
Model Evolution & Decisions
The project initially began with Meta’s Prophet model. While it worked well for long-term forecasting, it showed significant deviation for short-term predictions — which was critical for this use case.
After evaluating performance and researching alternatives, the system was rebuilt using LightGBM, which provided better control, improved accuracy, and faster training cycles for short-term AQI forecasting.
Another key decision was refining the dataset itself. Cities like Delhi showed extremely high variability, and Hyderabad had inconsistent data availability. To maintain reliability, the system was focused on: Bangalore, Chennai, Kolkata, and Mumbai.
"Building an AI system is not about picking a model — it’s about how well you connect data, logic, and real-world context into something meaningful."
Interface & Experience
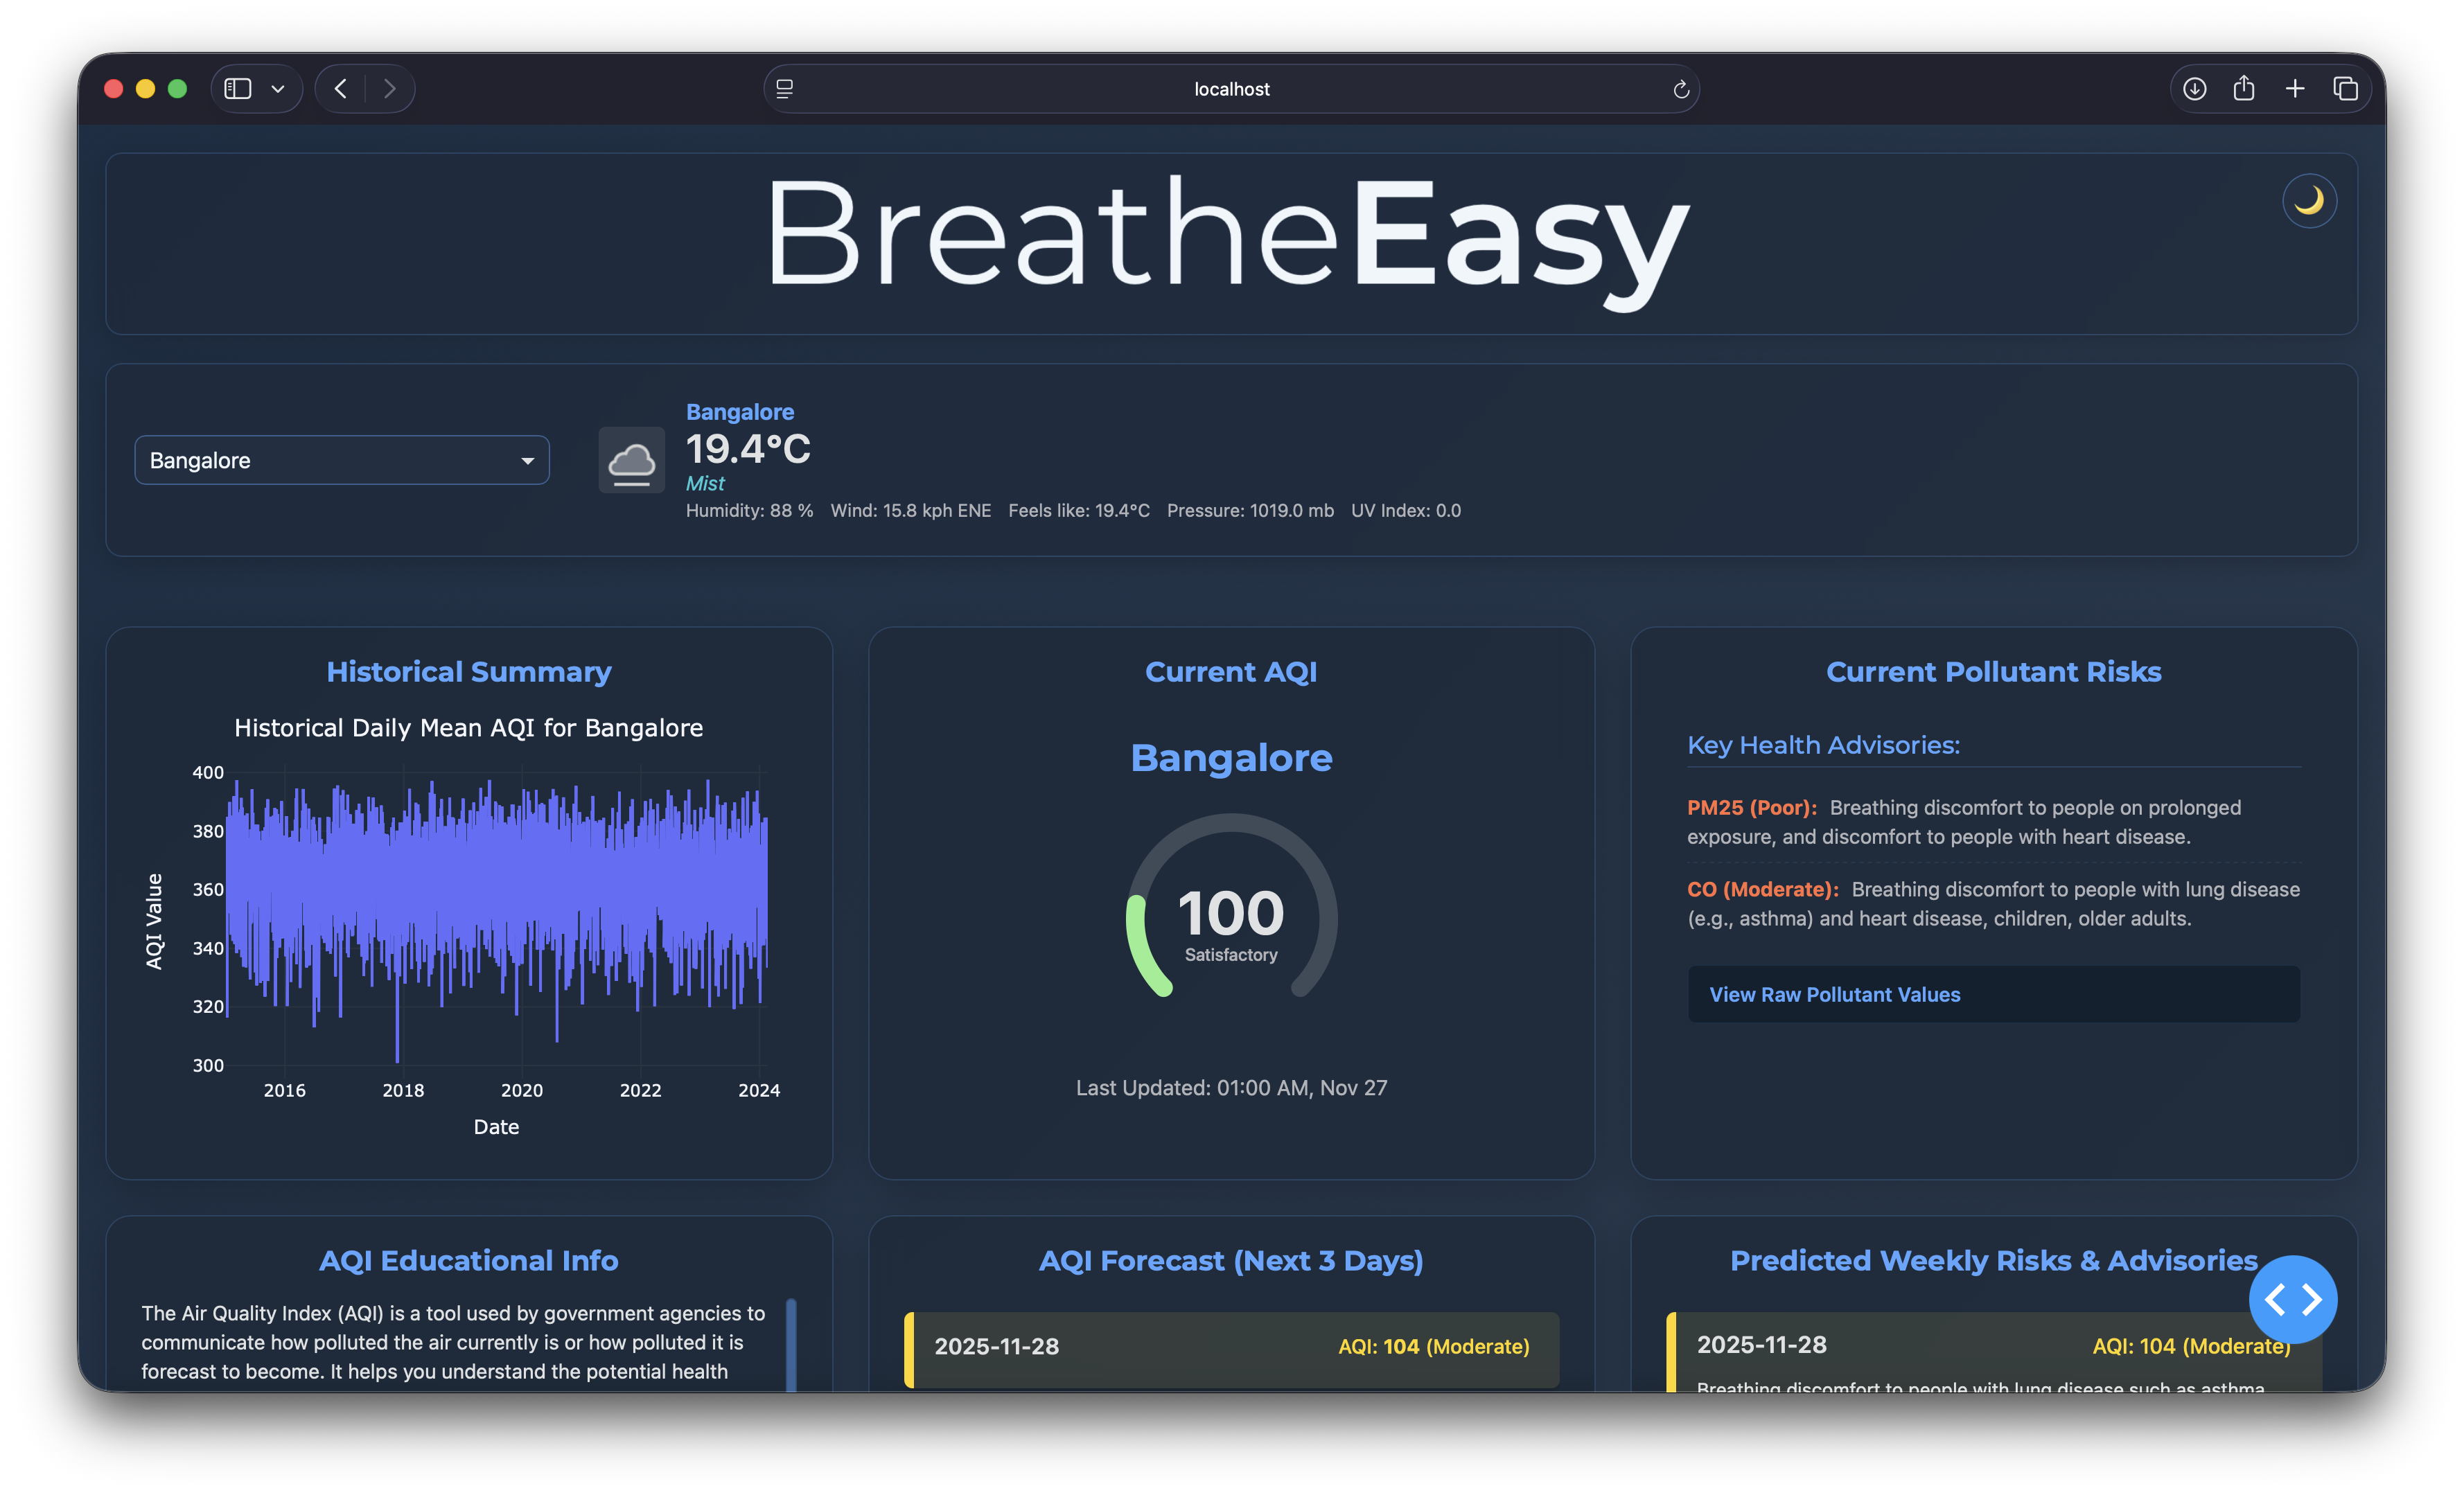
The interface translates complex AQI data into intuitive visuals, clear health advisories, and minimal interactions — making it usable even for non-technical users.
Alongside the main dashboard, the system includes a dedicated Live Performance Hub — a real-time monitoring interface that tracks CPU usage, memory consumption, network activity, and application logs. This ensures the system is not just functional, but also observable and reliable during runtime.
- —Real-time CPU, memory, and network monitoring
- —Live application logs and process tracking
- —Time-series performance visualization
- —Continuous background data collection
A major focus of the system was simplicity. The interface translates complex data into intuitive visuals, clear health advisories, and minimal interactions — making it usable even for non-technical users.
What Makes It Different
- —Self-correcting forecast model anchored to live AQI data
- —Clear health-based interpretation using CPCB standards
- —Integrated performance monitoring system
- —Minimalist UI focused on clarity over complexity
Reflection
Working on this project changed how I think about both data and systems. AQI is not just a number — it represents something real that affects people every day.
I also realized that building an AI system is not just about training a model. The real challenge lies in collecting reliable data, processing it correctly, and connecting everything in a way that produces meaningful output.
And most importantly — UI matters. Even the most accurate system fails if people cannot understand or use it.
Project Access
View Source Code on GitHub
Watch Project Walkthrough
Contributors
This project was built as a collaborative effort. While I led the system design, modeling, and overall architecture, it would not have been possible without the contributions of the team.
– Chirag P Patil — System Design, ML Pipeline, Integration
– Kimaya Anand — UI Development & Testing
– Arnav Vaidya — Data Handling & Support
"BreatheEasy is not just a project — it is a step towards making environmental data more understandable, accessible, and actionable."